

What Is Momentum?
Learning how to identify a trend is almost as important as fundamental research

One of the most important things I’ve learned in the public markets is identifying momentum, and being able to trade around it. What do I mean by momentum? There are precise, mathematical definitions of momentum used in quantitative finance. But I’m not a quant and I’m not using complex formulas, or a trading algorithm. I’m talking, in a general manner, about the tendency of stocks to go up and down in a trend. The trend can sometimes appear to be in a world of its own, immune to fundamental developments.
Earlier this year, in late January, uranium stocks went into a downtrend. It didn’t matter how many positive fundamental developments occurred over this period, the stocks just kept going down in nearly a straight line for about 8 weeks. The total peak-to-trough drawdown was around 27% for the major ETFs. If I was managing my portfolio 5 years ago, I would have re-checked the fundamentals of the sector a few days into the start of the sell-off, concluded that the market was crazy, and proceeded to double down on my position. A few weeks later I would be down another 15-20%, and this time with much larger position sizing.
A far better approach is to learn how to read a stock chart and ask yourself: Is the uptrend exhausted (can you identify major support and resistance levels, trendlines, consolidation and reversal patterns)? Is sentiment too bullish? Is volume picking up or declining? What kind of volatility and drawdowns has the sector exhibited in past cycles?
To understand why technical analysis works and why stocks trend up or down, it’s helpful to look at what’s going on at a more granular level. Upward momentum usually starts with a catalyst, such as the announcement of a nuclear reactor restart, life extension, or lowered supply guidance from a major mine. When such news hits, the uranium sector often experiences a buying frenzy, driving prices higher. This upward trend is self-perpetuating, as higher prices attract speculators. I call them ‘FOMO tourists’, people who don’t know the fundamental story but don’t want to miss out on the ‘next big thing’. They tour one sector after another, with no strong conviction or fundamental view, hoping to get in early on a parabolic move.
However, this upward momentum doesn't last. Once the news cycle slows and price action cools off, traders become more inclined to take profits. One of the major warning signs in an uptrend is declining daily trading volumes, and price reaching a prior, major resistance level. This is usually an indicator that the buyers have run out of steam and that new capital would need to come in to push the stocks higher. It was based on this observation that I warned readers to become cautious on uranium stocks about a month ago. I noticed that a number of stocks had started hitting their 2021 / 2022 highs (or come close), and instead of breaking through, were getting rejected from those price levels on declining volume.
Once liquidity starts to dry up, even minor selling can significantly impact the stock price. A price drop after a large run-up often has the opposite domino effect as on the way up: the initial decline causes traders to become cautious, prompting them to take profits. As price drops, some of the folks who bought the stock more recently find that their gains are close to vanishing. From a psychological point of view, seeing your gains disappear and turn into losses is unbearably painful. As PnLs turn from green to red, selling begets even more selling. The lack of fresh, positive news exacerbates the situation by failing to bring in new investments that could stabilize or reverse the downward trend.

The FOMO tourists, who haven’t done much fundamental work, fear that the bull thesis is wrong and see no point in waiting for a turn around. Some fundamentals-based, long-term investors, also start questioning the thesis. I remember earlier this year there were a lot naysayers claiming that uranium investors had miscalculated the amount of excess inventories, or had underestimated supply elasticity. In response, I wrote a detailed article on why the bearish takes were incorrect. It’s not a coincidence that these bearish views were gaining traction after 2 months of uranium equities being stuck in a downtrend. When market participants don’t understand momentum, they invent fundamental narratives to fit the price action. The combination of weak price action and cacophony of bearish narratives can be too much, even for some strongly convicted bulls who have done the fundamental work.
If you want to improve your returns by optimizing entry and exit points, you’ll need to get better at identifying and taking advantage of such moments. Like everything else in investing and trading, trying to identify tops/bottoms is a probabilistic endeavor, and no one signal or indicator will give you a 100% hit rate. But learning how to use a combination of indicators that you understand and follow, and experience looking at price action, chart patterns, and observing sentiment will give you an edge over time.
Here are some examples:
After years of studying charts, I’ve noticed that stocks often bottom at or just below high volume nodes, which represent accumulation zones. The logic behind why this works is that those price ranges are where a large percentage of investors and speculators break even on their positions.
For example, I wasn’t surprised that the uranium ETF URNM bottom’ed this year at $28-29 (orange circles on the chart below) given the large volume nodes (the blue and yellow horizontal volume bars) just above those price points and the fact that URNM bottom’ed at around the same level in June 2022.
It also made sense to me that URNM has found some support recently at the $42 area (red circle) given the large volumes that were traded at the $43-$45 range, just above.
(p.s. you can click to expand charts below).

I’ve also noticed that stocks often bottom at Fibonacci retracement levels. In the case of URNM, the stock found support at the 50% retracement three times, and recently bounced from the 0.786 retracement level. The uranium junior miners ETF (URNJ) recently bottom’ed almost exactly at the 0.618 level (see red circles).
While there is no fundamental, logical reason why these retracement levels should have any significance, I’ve found that a lot of investors and algorithms use them to trigger their buying and selling, making it a self-fulfilling prophecy.
A similar logic applies to moving averages. Certain moving averages such as the 50 day and 200 day can trigger a lot of automated buying / selling.
Finding a confluence of indicators increases the probability of identifying a strong support or resistance level. For example in the chart below, URNJ’s bounce at the 0.618 Fib retracement also coincides with the blue 50dma line.
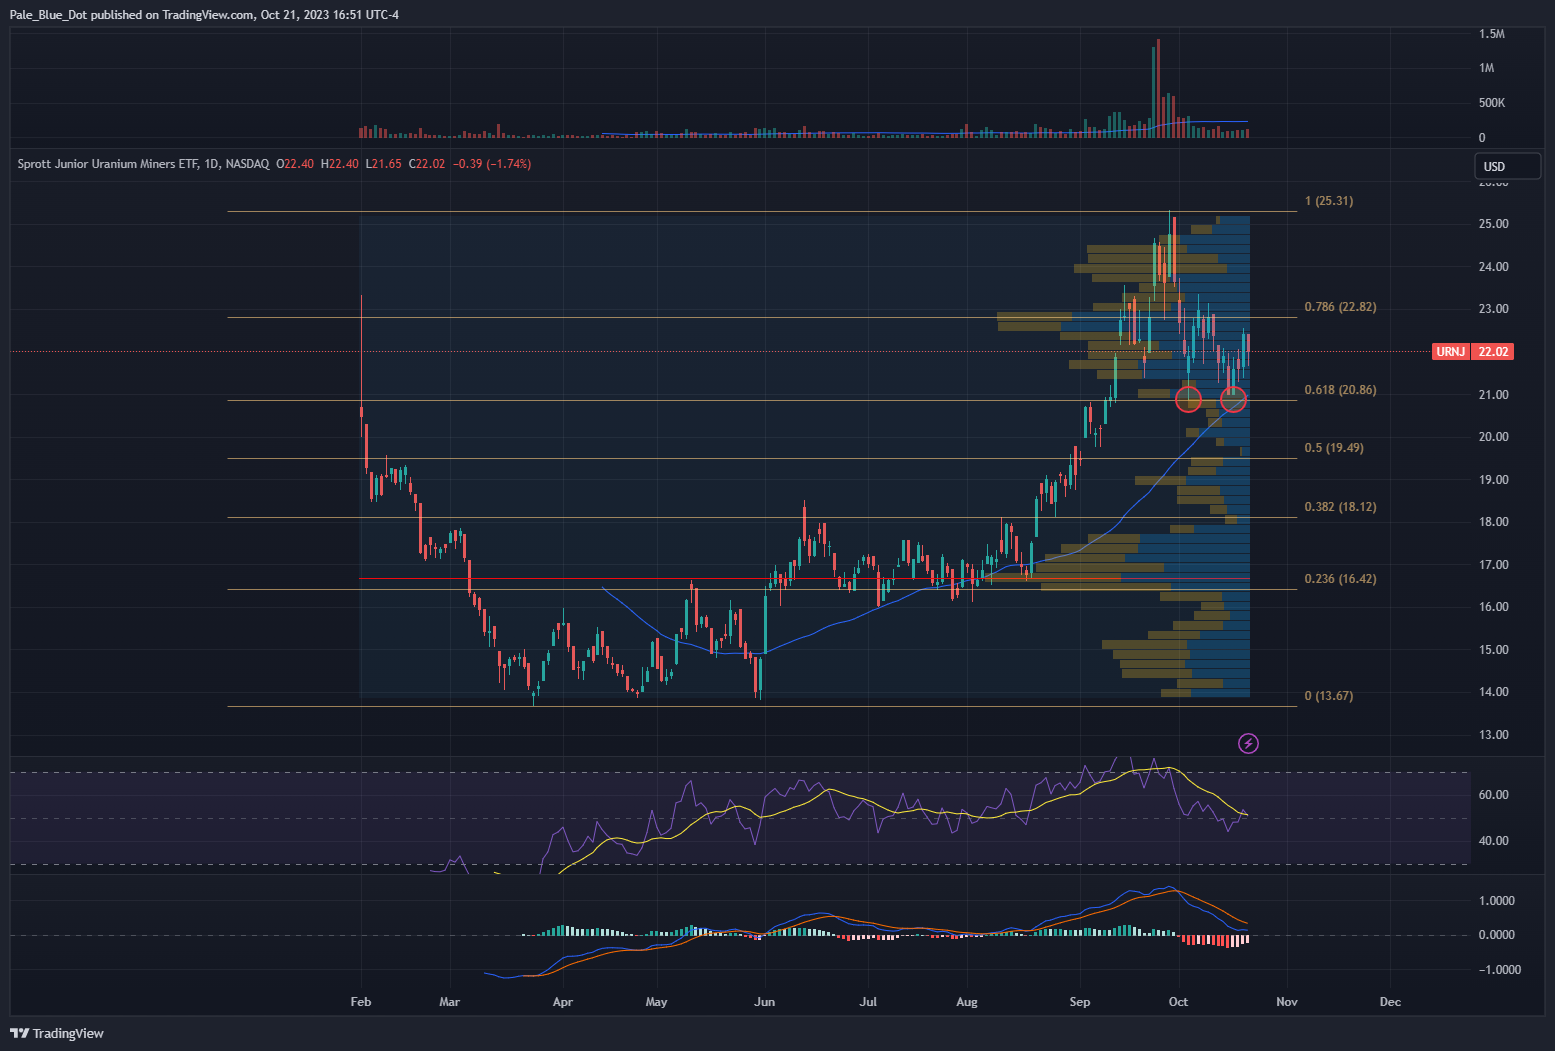
Daily trading volumes also offer important clues. Notice that URNJ trading volume dropped sharply on Sept 27th and Sept 28th after a parabolic, nearly uninterrupted rise starting August 18th. RSI also breached over-bought territory.
The ETF dropped 17% from Sept 29th to October 4th.
A topping patterns usually involves volumes declining as the stock approaches a resistance level, and then picking up again as the selling intensifying. In bottoming patterns it’s the opposite; volumes tend to decline as sellers eventually get exhausted and price refuses to break below a significant resistance level (a Fib retracement or a major moving average as discussed above).
Relative strength or weakness can also be a very strong indicator of momentum. Recently, I noticed that despite the SPX and QQQs being quite weak, the uranium stocks have been holding up.
Below is a side-by-side chart of URNM and U.UN (Sprott Physical Uranium Trust) divided by the SPX. You’ll notice a nearly V-shaped recovery in both, especially for U.UN, and also that the RSI (purple line at the bottom) is picking up.
This can be a sign that the downtrend in uranium stocks over the last few weeks has ended, and momentum has reversed. If such relative strength continues, investors and speculators will start to take notice and chase the green when everything around them is red. Buying will beget more buying, and the process I described above will repeat.

Conclusion
While downward momentum can be concerning, it's important to understand why it happens and how to take advantage of it. It also serves as a reminder to stay disciplined on position sizing, well-researched, and mentally prepared for price action that can often be completely disconnected from fundamentals. As a fundamentals-based investor, if you don’t understand momentum there is a strong chance that you will panic buy / sell at exactly the wrong times. Understanding how to read a chart, how to identify support / resistance and how to judge investor sentiment can greatly improve your IRR over time.
Thanks. I enjoy your insights. Ill use them. I so much enjoy how the colums are written.