Getting Constructive On Energy Again
The sell off looks overdone; I've started deploying cash, but slowly

July 5th was the largest percentage decline for the S&P/TSX Capped Energy Index since the COVID 2020 crash. In my June 22nd portfolio update, I had warned that there was more downside left in energy stocks, I wrote:
“Looking at oil, the market remains in deficit and inventories continue to grind lower but volatility has picked up as traders grapple with the risks of an economic growth slowdown and potential recession. Oil has also become a crowded trade recently which means that it’ll be subject to risk reversals and de grossing as financial pain spreads across all market participants. There is a saying that “bear markets don’t bottom until the leaders get taken out”. Energy has been leading this year.”
“From a technical perspective however oil stocks could fall another 10-20%+ in the near term to test their 200 day moving average and still be in a ‘bull phase’. Because of this possibility I think it’s prudent to wait before adding more to existing positions. Q2 results for oil companies in late July / early August will show very high levels of cash flow generation and should help provide a valuation floor.”

Markets are voting machines in the short term and weighing machines in the longer term. Today the markets are clearly voting to exit energy investments at all costs, but let’s take a step back and think about the fundamentals. Oil is currently trading at close to $100/ bbl. Despite the various structural supply challenges, the market thinks that oil prices are going to go a lot lower (oil equities are already pricing in closer to $50/bbl oil) because demand is going to fall off a cliff in a recession. Is that a rational expectation? Or is it paranoia? Let me take you through how I’m viewing the situation.
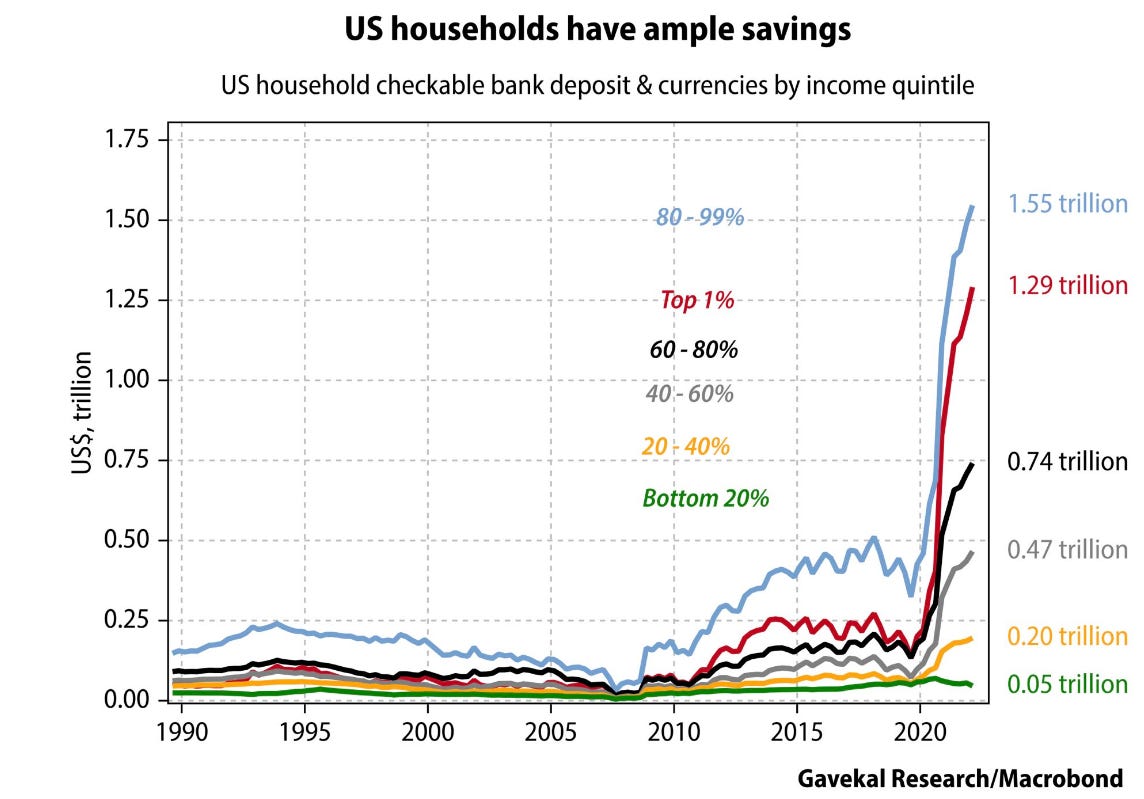
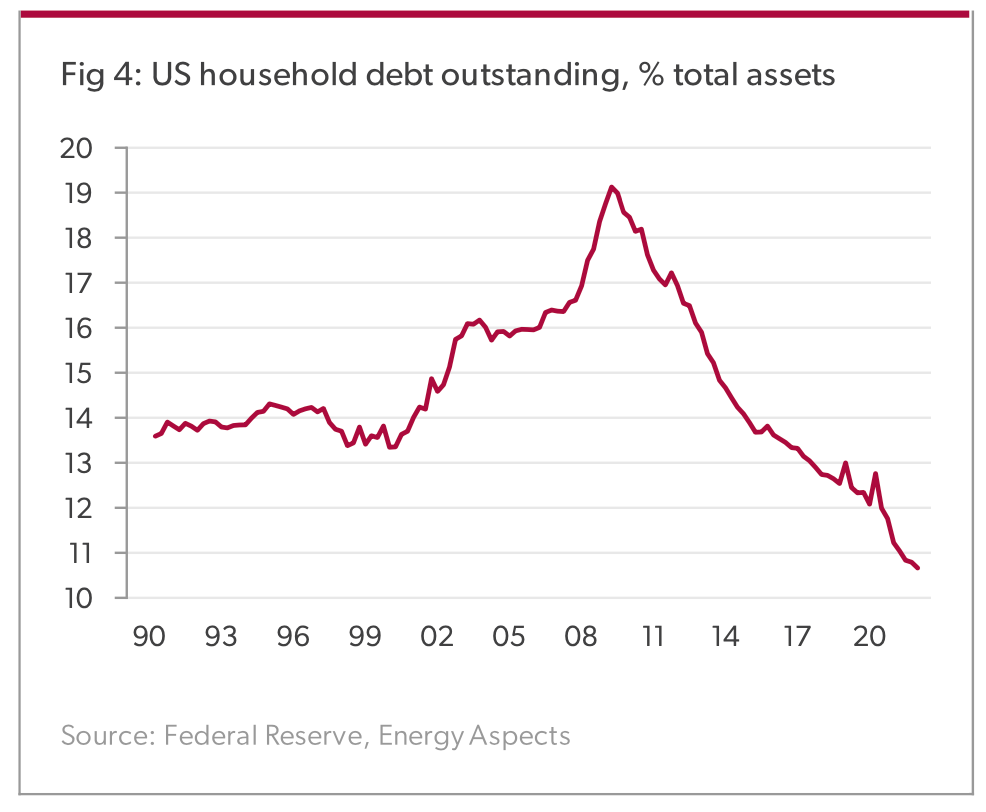
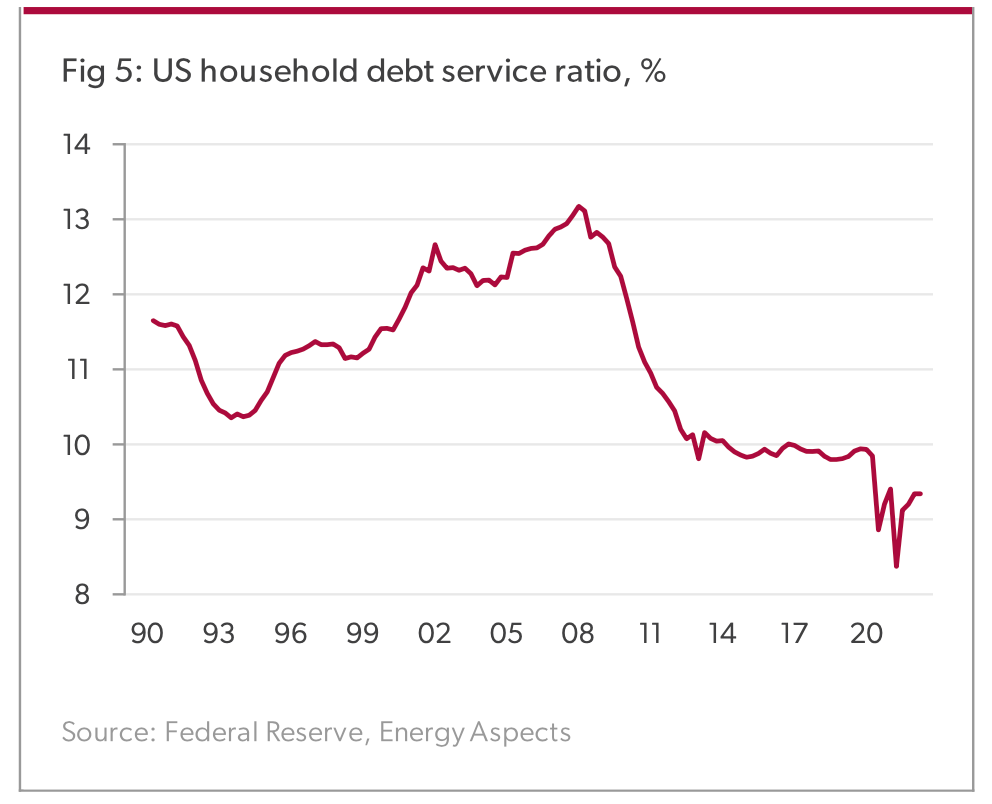
My first observation is that even though we might be in a recession or about to enter one, a sharp drop in oil demand is not a foregone conclusion. The economy is clearly slowing and leading economic indicators are weakening but US household balance sheets are strong and there is still a significant amount of excess savings relative to historical levels (except for the bottom 20% of earners).
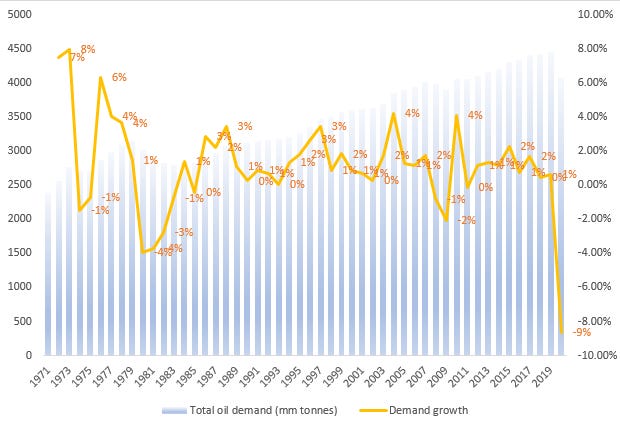
Second observation is that it’s historically very rare for oil demand to contract. During the early 90s recession and the post dot-com bubble recession in the early 2000s, oil demand growth dropped to 0% but did not contract. During the 2008-09 GFC, oil demand contracted 3% but this was a historic credit crisis in which the global financial system was on the brink of collapse. In the early 80s oil demand contracted by almost 11%, but that was due to a combination of improved fuel standards instituted by the government (car mileage increased 30% from 17 miles per gallon in 1978 to 22 miles per gallon in 1982) as well as an emerging market debt crisis. The 80s were also a period when a much larger percentage of total oil demand came from industrial usage which could be substituted. For example natural gas and coal displaced oil used in power generation. The COVID related demand contraction in 2020 was unique and is unlikely to be repeated unless we have a new, deadlier variant of the virus that emerges.
Third observation is that despite all the economic growth slowdown fears, the physical oil market is still extremely tight. How do we know this? There are three key data points one should focus on: 1/ crack spreads, 2/ time spreads and 3/ inventory levels.
Crack spreads are a measure of end product prices (gasoline, diesel etc.) relative to oil price and therefore a rough proxy for refining margins. When crack spreads are elevated, it means that end product demand is strong and refiners are economically incentivized to maximize refinery throughput (which means buying as much crude as possible). While crack spreads have declined from recent highs, they still remain significantly elevated from a historical point of view (almost 2x YoY levels and pre-covid 2019 levels for comparison). This means that end product demand is still strong (albeit the level of strength has moderated recently).

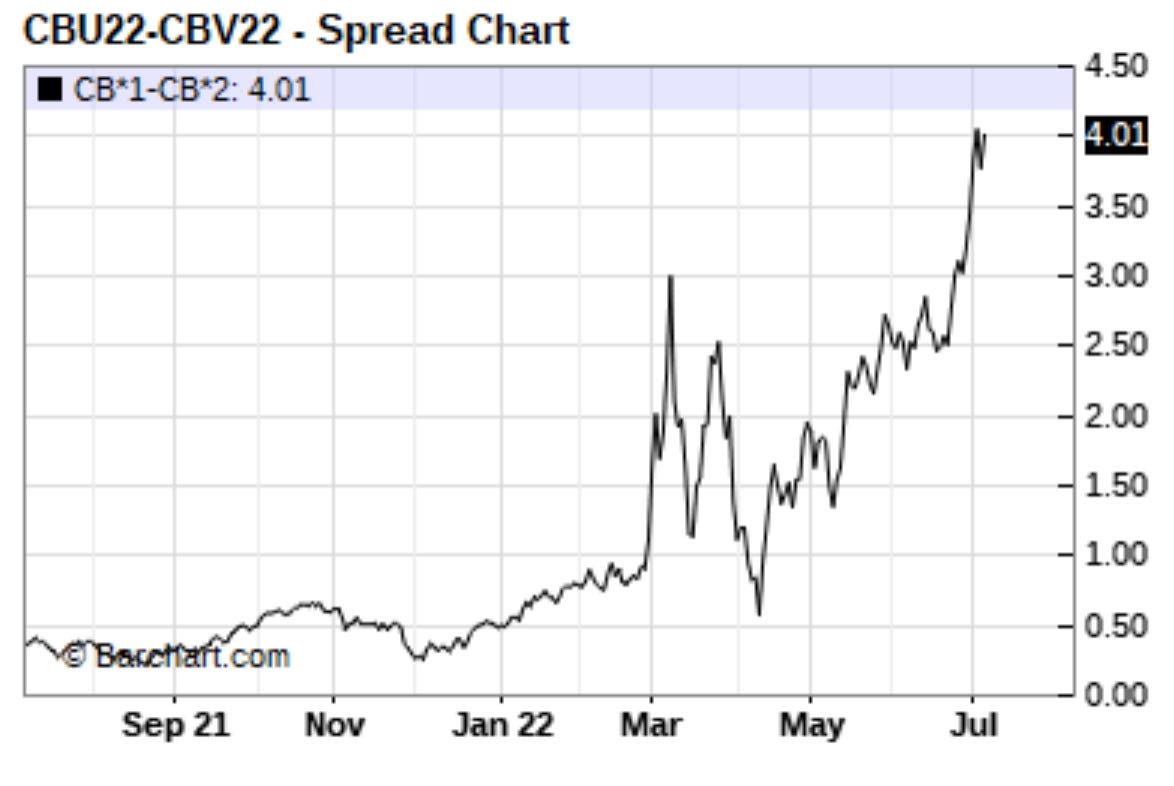
Time spreads are the difference in oil futures pricing for different periods. Brent time spreads show us a clearer picture of physical demand as WTI contracts are heavily influenced by financial flows. When time spreads are in backwardation, that implies a very strong physical market as traders are demanding oil at spot in favor of future barrels. A futures curve in backwardation provides incentive for the market to bring oil out of inventory. In contrast, a futures curve in contango encourages oil to go into storage (to be sold at a higher price in the future). The Brent 1-2 time spread (front month minus the month after) chart below shows how the market remains in backwardation which has steepened sharply over the last month. The 2-3 time spread shows a similar picture.
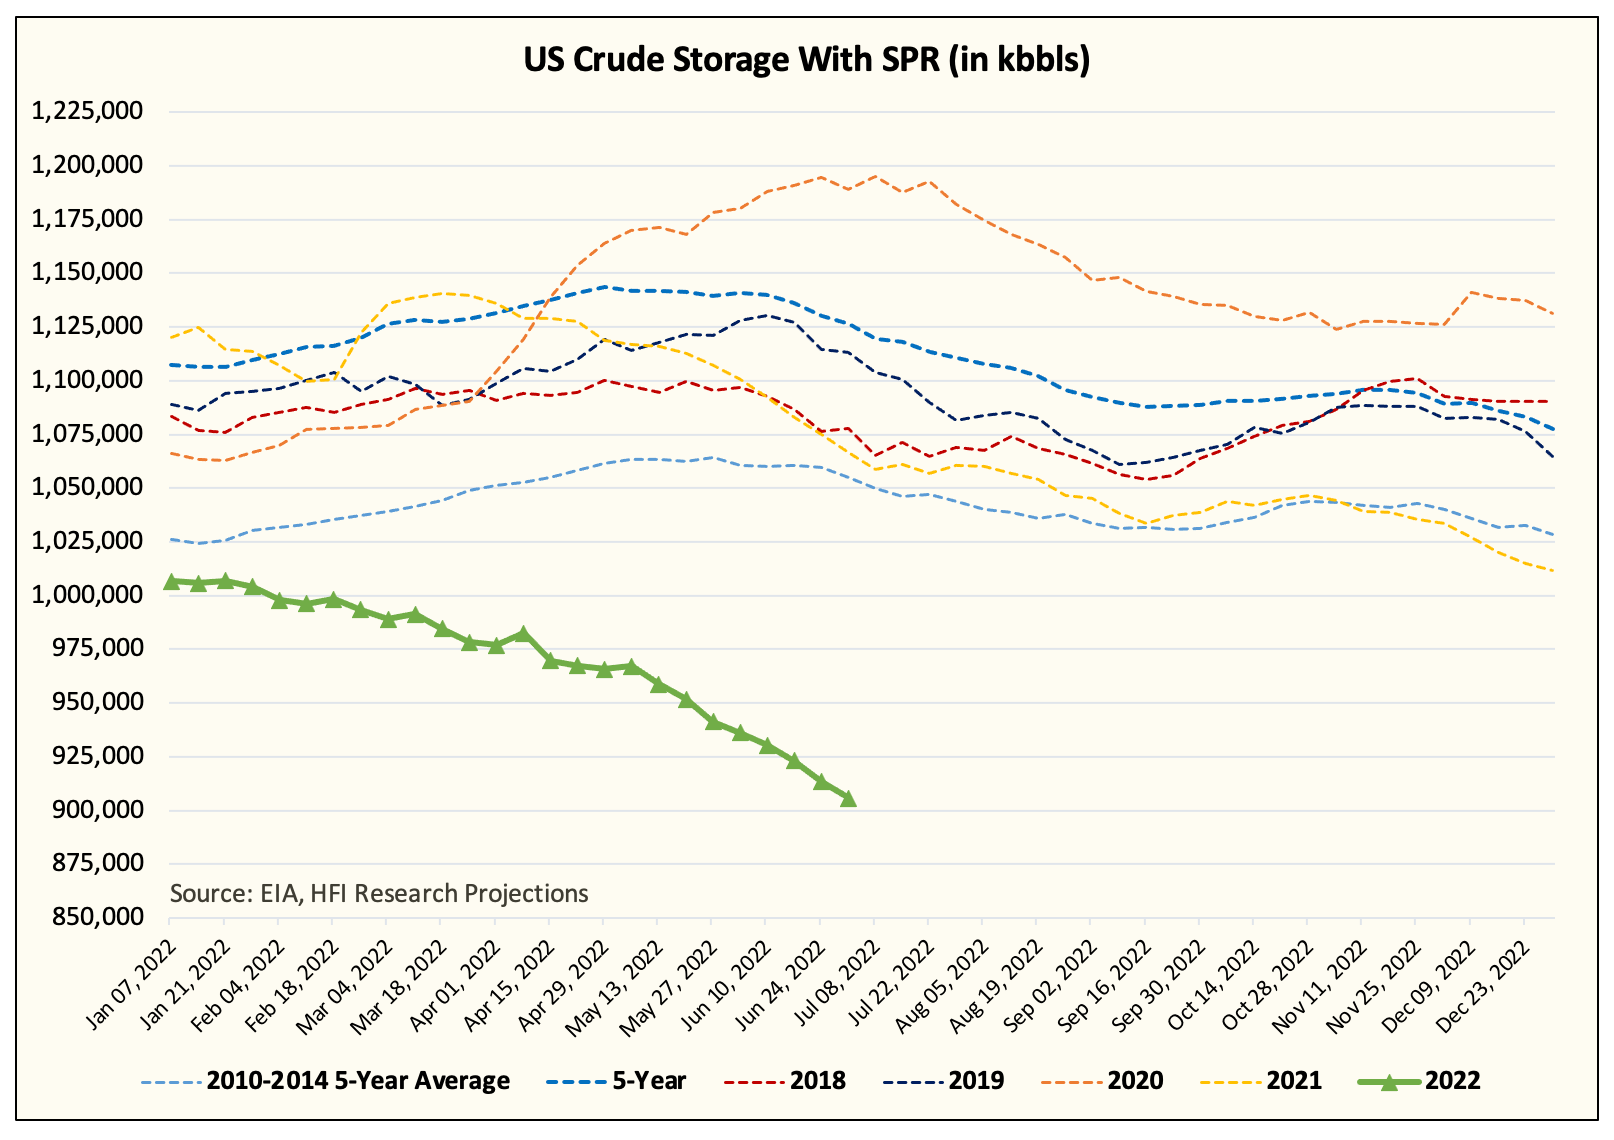
Inventories have been drawing all year. US crude oil stocks (including the strategic petroleum reserve (SPR)) are the lowest they’ve been since the 2010-2014 era of consistently high oil prices. The last EIA inventory report for the week ended 6/24 showed a build in distillate and gasoline inventory, but it’s too early to say that this is a new trend vs. a one-off. If oil and product inventories start building consistently, then we will know that the market has turned from a deficit to a surplus but it’s too early to reach that conclusion right now, especially in light of the other data points.
Fourth observation is that the oil market has been extremely strong despite Russian oil exports being HIGHER vs. before their invasion of Ukraine. India and China have been big buyers of Russian crude and Russia has been selling oil out of inventory to maximize near term cash flow.

This is not going to be sustainable in the long run as Russia will eventually run out of inventory and seaborne exports to the EU will come to a stop by end of this year. In fact early July data shows that Russian exports are already starting to drop:
Looking at the latest Kpler data, preliminary July figures show a sharp drop in Russian crude exports versus June and May. At ~3.9 million b/d, this represents a ~600k b/d decrease from June, and a ~1.2 million b/d decrease from May.
We suspect that if the logistical issues are real (and no reason to doubt otherwise), then we should see Russian crude exports bottom out at ~3.5 million b/d. This would represent a loss of ~1 million b/d versus pre-invasion levels. - HFI Research
So while oil demand might drop in a recession, oil supply from Russia will drop as well and cushion the blow. In fact the situation could escalate if Russia decided to ban its gas exports to Europe in retaliation to the oil export ban. 40% of gas consumed in Europe comes from Russia and a complete ban would lead to aggressive gas to oil switching which will be a significant tailwind for oil demand.
Last but not least, oil company valuations have become too cheap to ignore. Eric Nuttall, portfolio manager of the Ninepoint Partners Energy Fund, posted this chart recently showing that even at $70 WTI, the average Canadian oil E&P is trading at close to a 20% free cash flow yield (!). In other words at today’s market cap, these companies could use their free cash flow to buy back all their outstanding shares in 5 years if oil stayed at $70 / bbl.

In light of all the above, I think it’s prudent to start increasing one’s allocation to energy names, but cautiously. I say cautiously because short term moves are hard to predict and I can’t guarantee this is the THE bottom for energy stocks. If you deploy capital at a gradual pace and dollar cost average, you will avoid getting frustrated when the market moves against you in the short run. Deploying slowly also allows you to monitor the fundamental data to ensure that your thesis is correct and add more as your conviction increases. For example if crack spreads and time spreads started collapsing, that will be a signal that demand destruction fears were correct and that it’s time to get out. The upcoming Q2 earnings season could be a catalyst for sentiment to reverse for the energy sector given strong earnings and cash flow growth relative to other sectors.